You are currently browsing the category archive for the ‘economic data’ category.
The Office of the Superintendent of Bankruptcy Canada has released bankruptcy data for the first quarter of 2011. bankruptcies continue to trend lower than the recession peak, and closer to pre-recession levels.
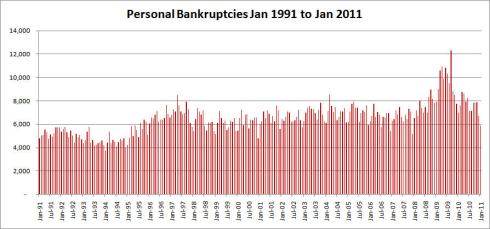
Here’s a long term graph of consumer bankruptcy data, from 1991 forward.
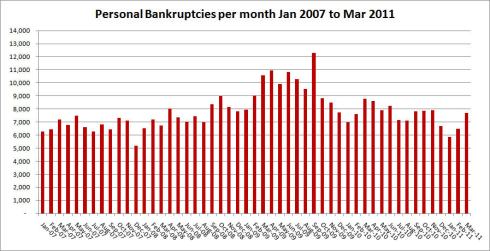
Since the beginning of 2007 (approximately pre-recession), you can see the leveling off in the short term chart.
In terms of actual numbers, here’s the comparison between the first quarter of 2011 and the first quarter of 2010.
Comparing bankruptcies and proposals (for consumers), the number of proposals for March (4,458) was the highest in the period I have data for (since January 2007).
For businesses, that same trend is not evident even though there was an up tick in both bankruptcies and proposals in March (bankruptcies up from 287 in February 2011 to 399 in March and proposals up from 81 to 169).
Statistics Canada has released its Labour Force Survey for March 2011. The unemployment rate was barely changed from the prior month (down to 7.7% from 7.8%). Here’s a long term chart from 1976 to the present.
A shorter term chart (January 2008 to present) shows the changes since the period immediately prior to the recession.
The shorter term chart highlights how unemployment, which initially rose quite quickly, has been slow to come down.
It still remains lower than the US rate, though the US rate had been falling faster than the Canadian rate and the difference between the two is not as large as it once was.
The current difference is 1.1% (7.7% in Canada vs. 8.8% in the US), but in April 2010 the difference was 1.8% (8.1% vs. 9.9%).
The Office of the Superintendent of Bankruptcy Canada has released its insolvency statistics for January 2011. The number of consumer insolvencies for January 2011 (5,864) was the lowest since December 2007 (when there were 5,192) and the lowest figure for the month of January since January 2000 (when there were 5,451).
Here’s the long term graph for consumer insolvencies (aka personal bankruptcies) going back to the beginning of 1991:
A closer view looking just since the period immediately preceding the recession:
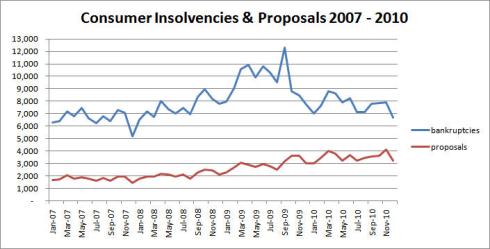
For the same period (January 2007 to present) the decrease is bankruptcies is not matched by a decrease in proposals (the number of proposals actually increased from the prior month from 3,219 to 3,342).
The implications of this? I’m not sure if there’s any data on what proportion of proposals eventually end up as bankruptcies, but the increasing number of proposals seems to mitigate some of the gain from the decrease in actual bankruptcies.
For businesses the trend continues to be a bit different, with proposals decreasing along with bankruptcies, though decreasing at a much lesser rate.
Related to the last post regarding bankruptcy data released by the Office of The Superintendent of Bankruptcy Canada, for the last three calendar years (January 2007 through December 2010) I’ve taken the data for both consumer and business insolvencies as well as for proposals.
The definition of Proposal from the OSBC website:
An offer to creditors to settle debts under conditions other than the existing terms. It is a formal agreement under the Bankruptcy and Insolvency Act.
First the consumer insolvencies and proposals.
Interesting to note that while actual insolvencies have been declining, proposals have not been and in fact show an opposite trend.
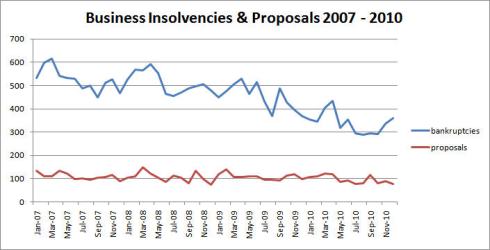
Now business insolvencies and proposals.
Business insolvencies peaked earlier, though the last couple of months have moved up significantly (which was not the case in November and December of 2009), even though business proposals have been flat.
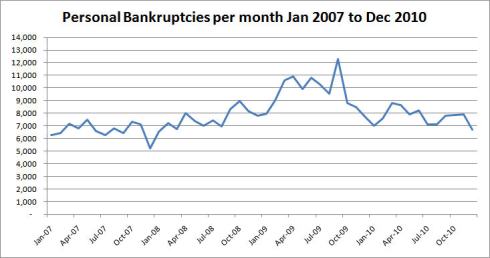
Today the Office of the Superintendent of Bankruptcy Canada issued the consumer insolvency statistics for December 2010. Consumer insolvencies (personal bankruptcies) were down compared both to the prior month and to the prior December.
Since September of 2010 the monthly figures have been running below 2009 and 2008 levels, but still above the levels recorded in 2007 (prior to the recession).
Here’s a chart for the same period.
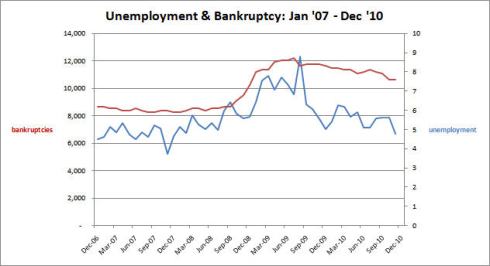
For the same period here’s a chart showing personal bankruptcies compared to the unemployment rate for the same period.
From the chart it is evident that bankruptcies have dropped more than unemployment, but still remain elevated compared to pre-recession levels.
And the long term chart (for bankruptcies) going back to the beginning of 1991.
It’s interesting to compare the data for Canada to the data from the United States. Calculated Risk has posted a chart for annualized personal bankruptcies going back to 1996 (note the abrupt change from 2005 to 2006 is due to a change in American bankruptcy legislation). Here’s the US chart (from Calculated Risk, not me).
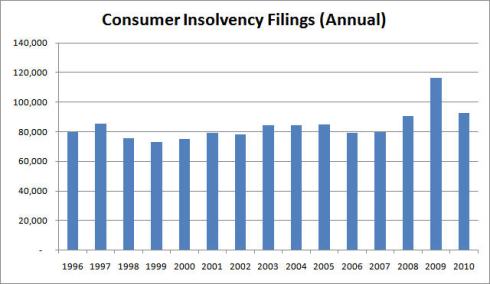
And for comparison here’s the Canadian chart for the same period.
Just looking at the period since the recession period, bankruptcies in Canada have eased off from their highs compared to the US figures.
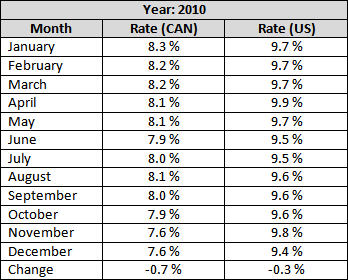
The unemployment figures for December 2010 were recently released for both Canada and the USA. Simple summary: Canada no change at 7.6% and for the USA a decline from 9.8% to 9.4%. Here’s the data for both countries for 2010 showing the rates for each month and the change from January to December:
Here’s the long term chart for Canada (going back to the beginning of 1976):
And a shorter term chart for Canada (since January of 2008 – prior to the start of the recession).
It’s quite noticeable that despite the improvement, unemployment is coming down much more slowly than it went up.
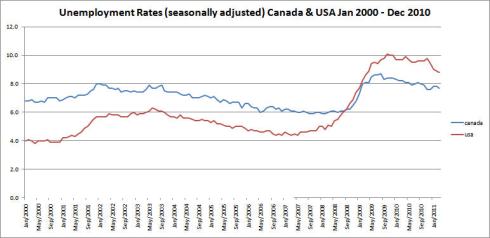
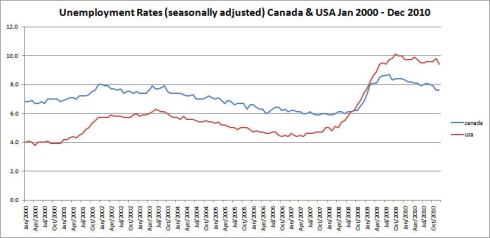
And here’s the graph comparing Canada and the USA from January 2000.
All figures are based on officially reported unemployment rates, which as always are open to some dispute.
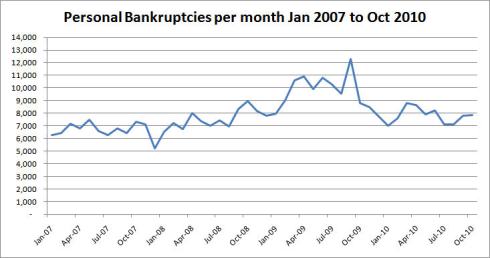
The Office of the Superintendent of Bankruptcy Canada has released the figures for October 2010 for consumer insolvencies. In October there were 7,844 insolvencies.
The figures continue to be below the peak numbers of 2009 and October is the second month in a row that the bankruptcy numbers have been lower than the numbers for 2008, though they’re still higher than the numbers for 2007.
Here’s the long term chart with data from 1991 onwards.
And another chart showing the data just previous to the current recession to the present.
So while the numbers have been going down, they still remain above pre-recession levels. The figures continue to be below the peak numbers of 2009 and October is the second month in a row that the bankruptcy numbers have been lower than the numbers for 2008, though they’re still higher than the numbers for 2007.
The numbers in Canada have at least been declining unlike in the United States where the personal bankruptcy figures for 2010 exceeded those of 2009. Note that, however, all the figures for 2010 are not yet available for Canada.
Statistics Canada has released it’s Labour Force Survey for November 2010 showing a drop in the overall unemployment rate from 7.9 to 7.6%. This is the lowest the rate has been since January of 2009 when it was 7.3%.
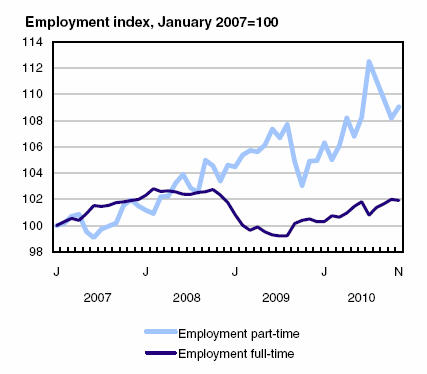
According to the survey, over the past year part time employment has grown by 4% whilst full time employment has grown by 1.4% (page 8 of the document). A person who got a part time job is no longer considered unemployed, even if they were (or still are) seeking full time employment. They may be underemployed, but Stats Can does not publish an underemployment rate or a quality of employment index (that I know of). From page 11 of the survey, here’s a chart showing the changes in full vs part time employment since January 2007.
The full time employment index has yet to recover to pre-recession levels, though the part time employment index is well above its pre-recession level.
Private sector employment has also remained relatively weak. Another chart from page 11 of the survey showing that the private sector employment index has yet to recover to its pre-recession level.
Also interesting about the above graph are the changes in the self-employment index (which is really just another part of private sector employment as far as I can tell).
The change in the unemployment rate was also driven by a decrease in the participation rate for the 15 to 24 age group. In October the participation rate was 64.1%, for November it was 63.2%. So even though employment in this age bracket was little changed, from 2,402,700 in October to 2,407,500 in November, there was a large change in its unemployment rate, from 15.0% to 13.6% (the numbers are taken from the tables on page 27 of the LFS).
Here’s a graph showing the most recent month’s data as part of the historical data series going back to 1976.
And here’s a short term chart covering the last three years (essentially the immediate pre-recession period to present) showing the slow recovery in employment.
In the USA the unemployment rate increased in November to 9.8%, up from 9.6% the previous month. Here’s a comparison of the Canadian and American unemployment rates since January 2000.
Today the Office of the Superintendent of Bankruptcy Canada released the figures for September 2010 (later than usual since it’s part of the quarterly report). Consumer insolvencies for September were 7,822.
Here’s a table showing the most recent figures compared to the preceding three years.
And a graph showing the same data – essentially the period immediately preceding the recession to present.
The overall pattern is one with bankruptcies off the peak but still somewhat elevated. Here’s the long term graph with the data going back to January 1991.
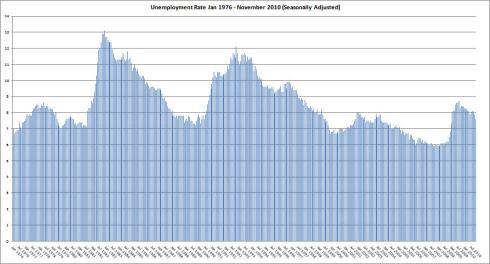
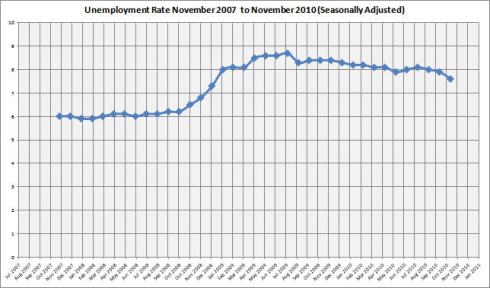
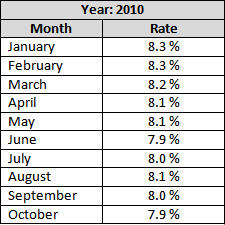
Statistics Canada has released the unemployment data for October 2010 showing a small downtick in the rate from 8.0% to 7.9%. This leaves the rate in generally the same trending area it has been in for most of the year. Here’s a table with the year to date numbers.
On the long term chat you can see the flattening out.
The shorter term chart makes the current meandering trend more visible.
The change at least compares favorably with the US where the unemployment rate was unchanged for the month at 9.6%. Here’s a table with a summary of the differences between the two.
Here’s a chart comparing rates in the two countries for the past decade.
From the chart you can see the US rate starting to rise earlier and for a longer period.
Interesting note I didn’t realize. The Bureau of Labor Statistics (where I got the US data from) doesn’t charge anything for their datasets. Statistics Canada charges $3.00 per dataset. So if you want unemployment data broken down by age, education etc you pay for each category within that dataset (ie. each age group or educational grouping counts as one dataset that you are charged for – so 5 age groups, you pay $15.00). I’d be inclined to do more analysis otherwise.


